
INSIGHTS Making Big Data Work for You

Perhaps you are familiar with Excel sheets (.csv, .xls) and how unwieldy they become when the dataset grows to a certain point. We’ve decided to optimize our processes by using HTML tables to show our users the revalued data instantly in our application. Here, I will explain how we optimized our code by increasing MySQL performance, handling a huge http response, and made our users happier by using fancy HTML table plugins instead of boring Excel reports.
Optimize your workflow by using DataTables instead of Excel sheets
Why we do what we do
In this article I will explain how we optimized our code by increasing MySQL performance, handling huge HTTP responses and how to make our users happier by using a fancy HTML table plugin, rather than Excel
That is huge!
Let’s say we have 500 000 products which are live and every day we collect the information we need for these.
For example:
- turnover rate
- since when is the product in the shop
- return quota
- and other KPI
This would be for one year 365 (days) * 500 000 (article) = 182500000 rows in our DB! This is a huge result set and as you can guess, soon, the generated Excel sheets are getting too big and slow while generating them. Of course, we aggregate the data for the user so they only see the important information, but the outcome is still huge.
Boring DUH!
Maybe you wonder now, why should I continue reading? There are several ways to deal with, like utilizing ajax and pagination, then everything is fine. But maybe I can still show you some new stuff that may change your point of view. Sometimes it is necessary to display all the data, because you need to calculate or interact with it.
Join to Death
First of all, you should always optimize your queries. As I already mentioned, we are using MySQL and the first task was making the query quick and efficient, therefore we analyzed the query and reduced the typical query blockers.
Here are some basic things you should be aware of:
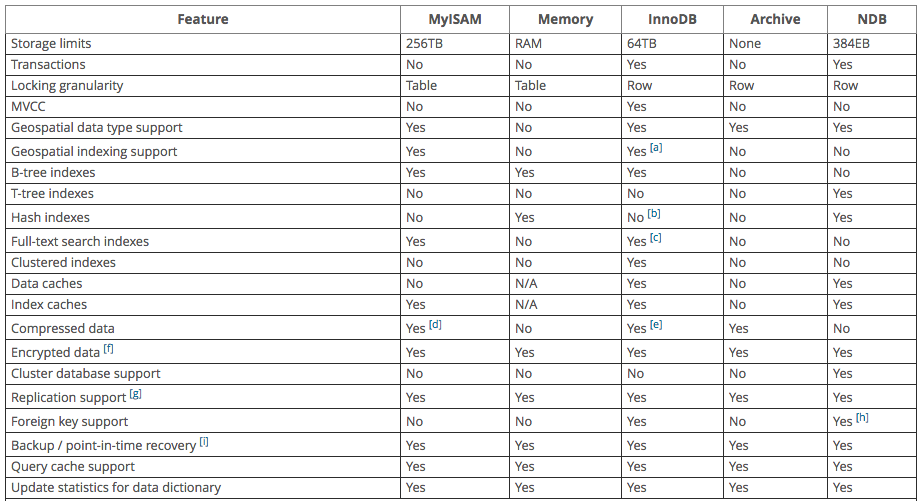
Choosing the Right Engine
It is important from the very first second of creating tables that you know which engine you want to use. There are currently 5, but the most common ones are:
- MYISAM (default engine — better for reading operations)
- INNODB (more less better for writing operations)
- MEMORY (if you can run the TABLE in memory)
Add Missing Indices —Use the index, Luke!
There are a lot of things to be aware of, but in general you should use indices, and if you know what you are doing, you should write combined indices if it is possible.
Careful! Every index has its own space on the disk. After every INSERT, UPDATE, or DELETE, the index will be refreshed.
Useful: http://use-the-index-luke.com/
Reduce the Amount of Unnecessary Joins by Using Subqueries
Every kind of join makes the query a bit slower, and if it is avoidable, try to use subqueries. This will do the trick in most slow query cases, combine with the right usage of indices.
Avoid using GROUP BY
GROUP BY is one of the biggest reasons why queries are slow. It can force the query to do disk operations by creating temporary tables, and you definitely don’t want that. And by the way, DISTINCT is internally, also a GROUP BY!
Bad Example
| SELECT | |
| a.id | |
| b.name, | |
| s.name, | |
| s.address, | |
| max(ap.price) as newest_price, | |
| wm.quantity | |
| #— …. | |
| FROM article a | |
| JOIN brand b on a.brand_id = b.id | |
| LEFT JOIN supplier s ON s.id = a.supplier_id | |
| LEFT JOIN article_price ap ON ap.article_id = a.id | |
| GROUP BY a.id |
Better example
| SELECT | |
| a.id, | |
| (SELECT name FROM brand WHERE id = a.brand_id) as name, | |
| (SELECT group_concat(name) FROM supplier WHERE s.article_id = a.id) as supplier_names, | |
| (SELECT max(price) FROM article_price WHERE article_id = a.id) as max_price | |
| FROM article a |
In our case it was not so simple. We had to create a table which gets filled every day with the daily KPIs. For faster reading, we decided to use the engine MYISAM. So now the query was fast, but the frontend was still too slow, and we had to render all 500 000 products with its aggregated data.
On Page Load is so 2010
In the beginning, when I started programming, I often heard that a good developer has to use ajax requests to be top notch in the web community. What if I tell you now, that this is not always the best way to deal with a huge response? We started of course with ajax requests. Fetching from our DB was less than a second, however the fetching by the ajax request was unbelievably slow (60 seconds or more). We analyzed the response and found out that the generated and human readable JSON response was the issue. It was simply too huge and needed a lot of time to render (>10 MB).
| { | |
| "data": [{ | |
| "variable_1": 100001, | |
| "variable_2": "Variable name", | |
| "variable_3": "Variable name 2", | |
| "variable_4": "2017–01–01", | |
| "variable_5": [ | |
| "value 1", | |
| "value 2" | |
| ], | |
| "variable_6": 8, | |
| "some_other_randomly_long_and_readable_kpi_key": 10 | |
| }] | |
| } |
It was not possible to reduce the selected data within a row. One solution would be to shorten the keys to one letter and generate a much smaller response, like the following example:
| { | |
| "data": [{ | |
| "a": 100001, | |
| "b": "Variable name", | |
| "c": "Variable name 2", | |
| "d": "2017–01–01", | |
| "e": [ | |
| "value 1", | |
| "value 2" | |
| ], | |
| "f": 8, | |
| "g": 10 | |
| }] | |
| } |
This is not maintainable, so we added the data to the initial page request and provided our view with the ready-built and human readable JSON data as a global Javascript variable. This prevented us from using any other requests to fetch the data.
It gave us the speed we were looking for. Now, we had the speed and all of the needed data, so we could focus on our users, showing them their data in a nice and flexible table.
DataTables for the win
This was the first day we used DataTables (http://www.datatables.net). DataTables is a highly flexible jQuery Javascript library, based upon the foundations of progressive enhancement, and gave us the opportunity to add advanced interaction controls to our HTML tables.
The DataTables community is big and the documentation is also great, allowing us to find all needed plugins or code examples that would improve the experiences of our users.
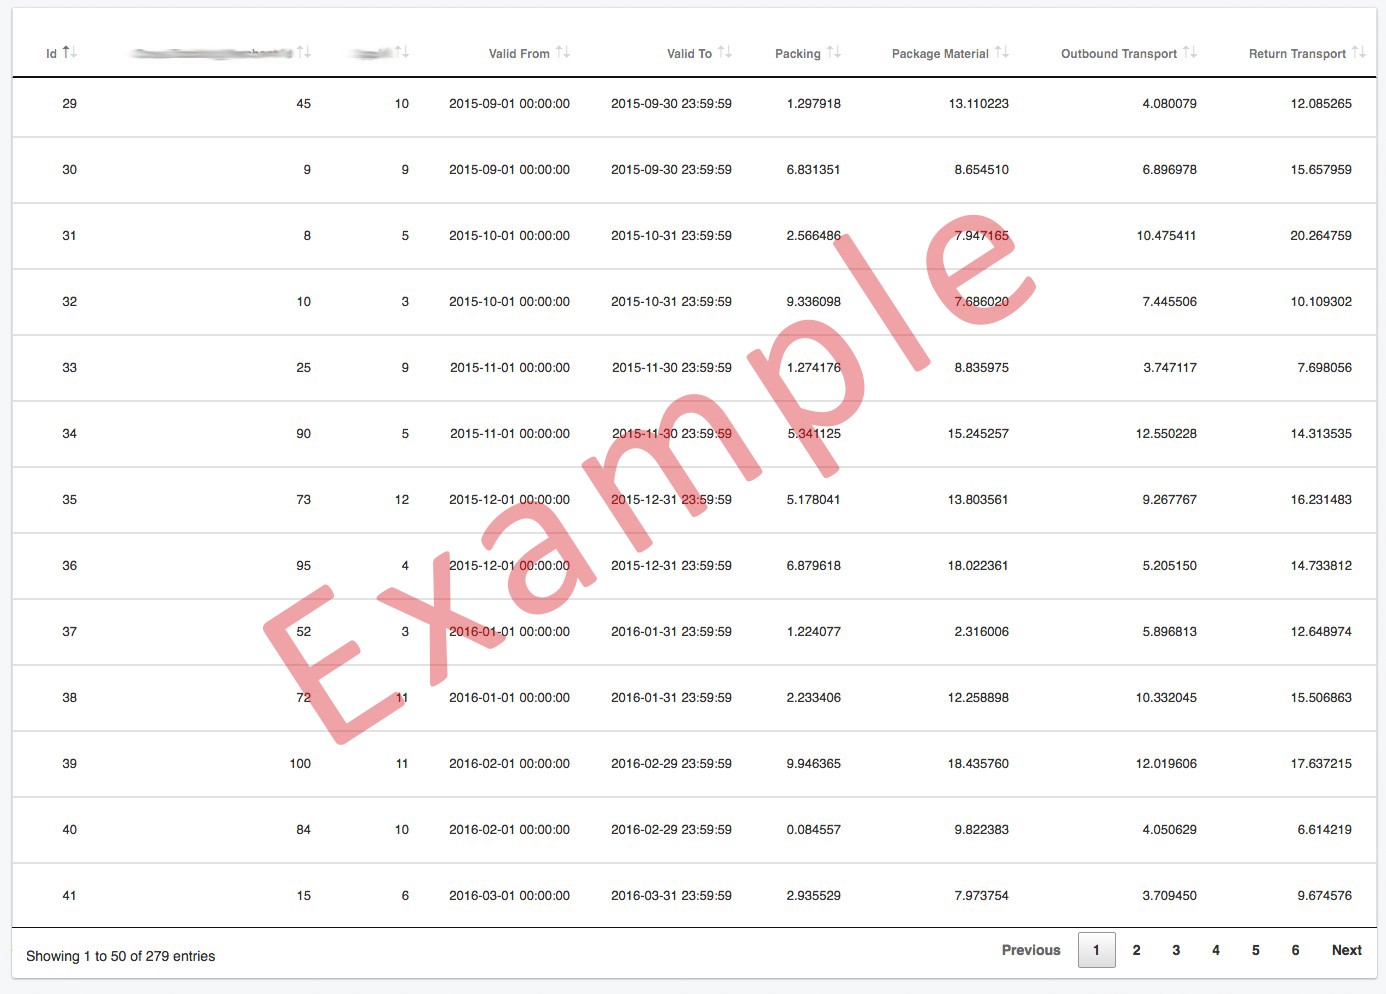
This was just the tool we were looking for! From the moment we combined DataTables with our data, our users had instant, easy access to all necessary tools to improve workflows as well as all of their commonly used functionalities such as sorting, filtering, searching, and much more. This is also the reason why we needed all the aggregated data at once in the view, as sorting or searching could be handled by the DataTables plugin.
Conclusion
We experienced a positive response from our users after integrating DataTables (or any kind of web views) to display their aggregated data. The biggest wins were of course the speed, instant search, and sorting filters. Users found themselves with new opportunities to analyze the data more efficiently. On the developer side, it’s now much easier to extend the table, write tests, or identify bugs.
All in all, this is a nice and modern method of displaying huge amounts of data.
Did you like my article? Check out our latest vacancies and join our team at ABOUT YOU!
More articles

From Prototype to Production
Adapting workflows to fit teams and their products — Christian Flack

ABOUT YOU TECH
ABOUT YOU TECH